
Recipe Analytics
On the WP Recipe Maker > Settings > Analytics page you have the option to enable Local Tracking of Recipe Analytics:
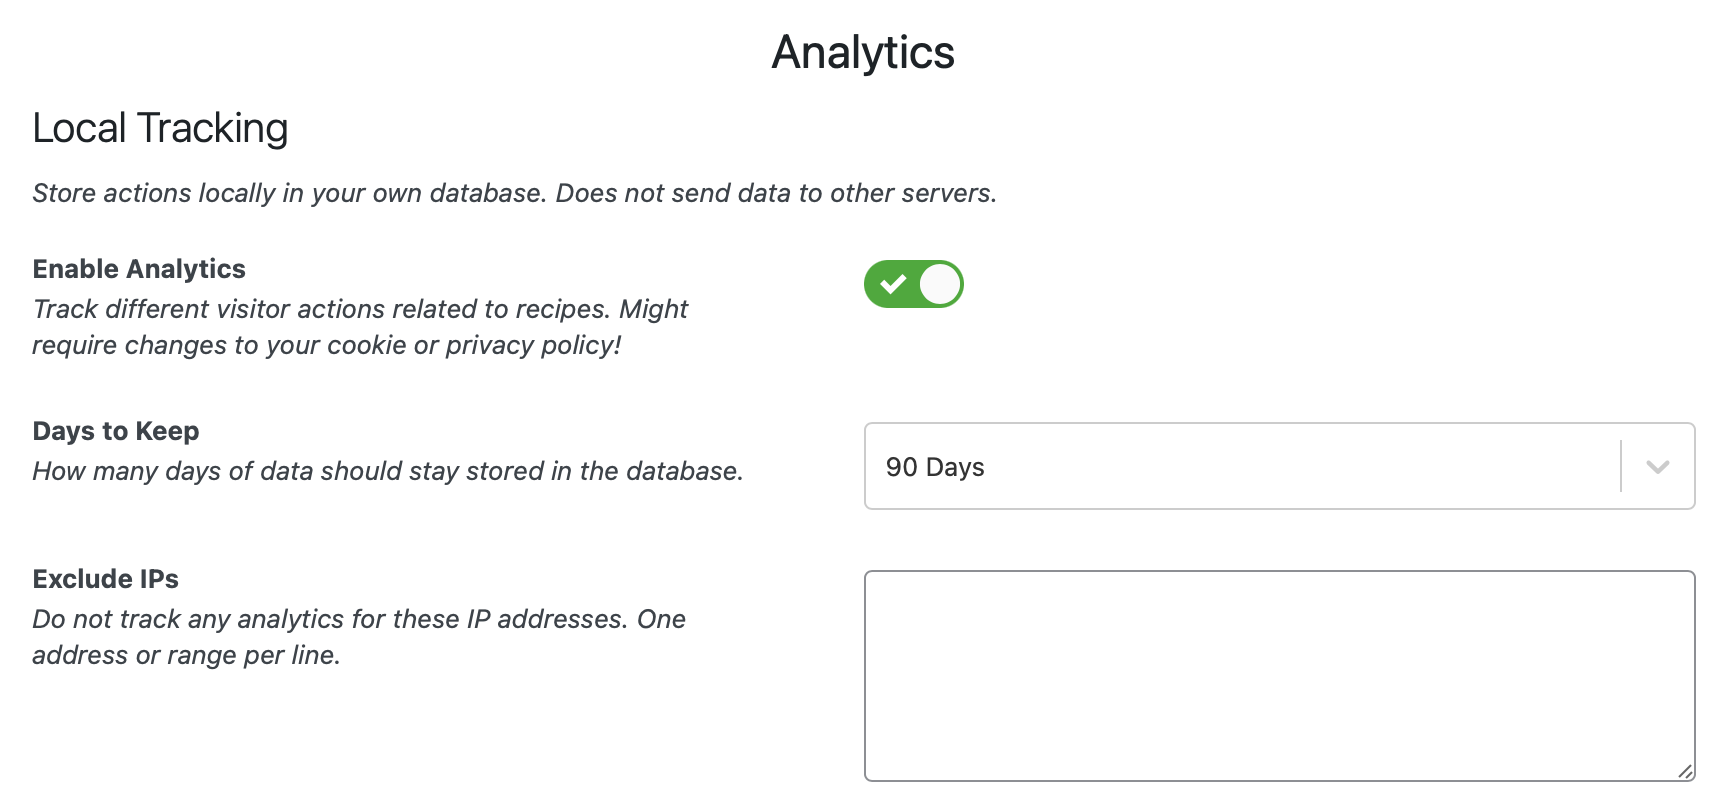
What this does is track different interactions that your visitors can have with recipes: clicking the jump to recipe button, printing a recipe, rating a recipe, adjusting servings or unit system, …
Once enabled, you’ll find some charts displaying that data on the WP Recipe Maker > Dashboard page:
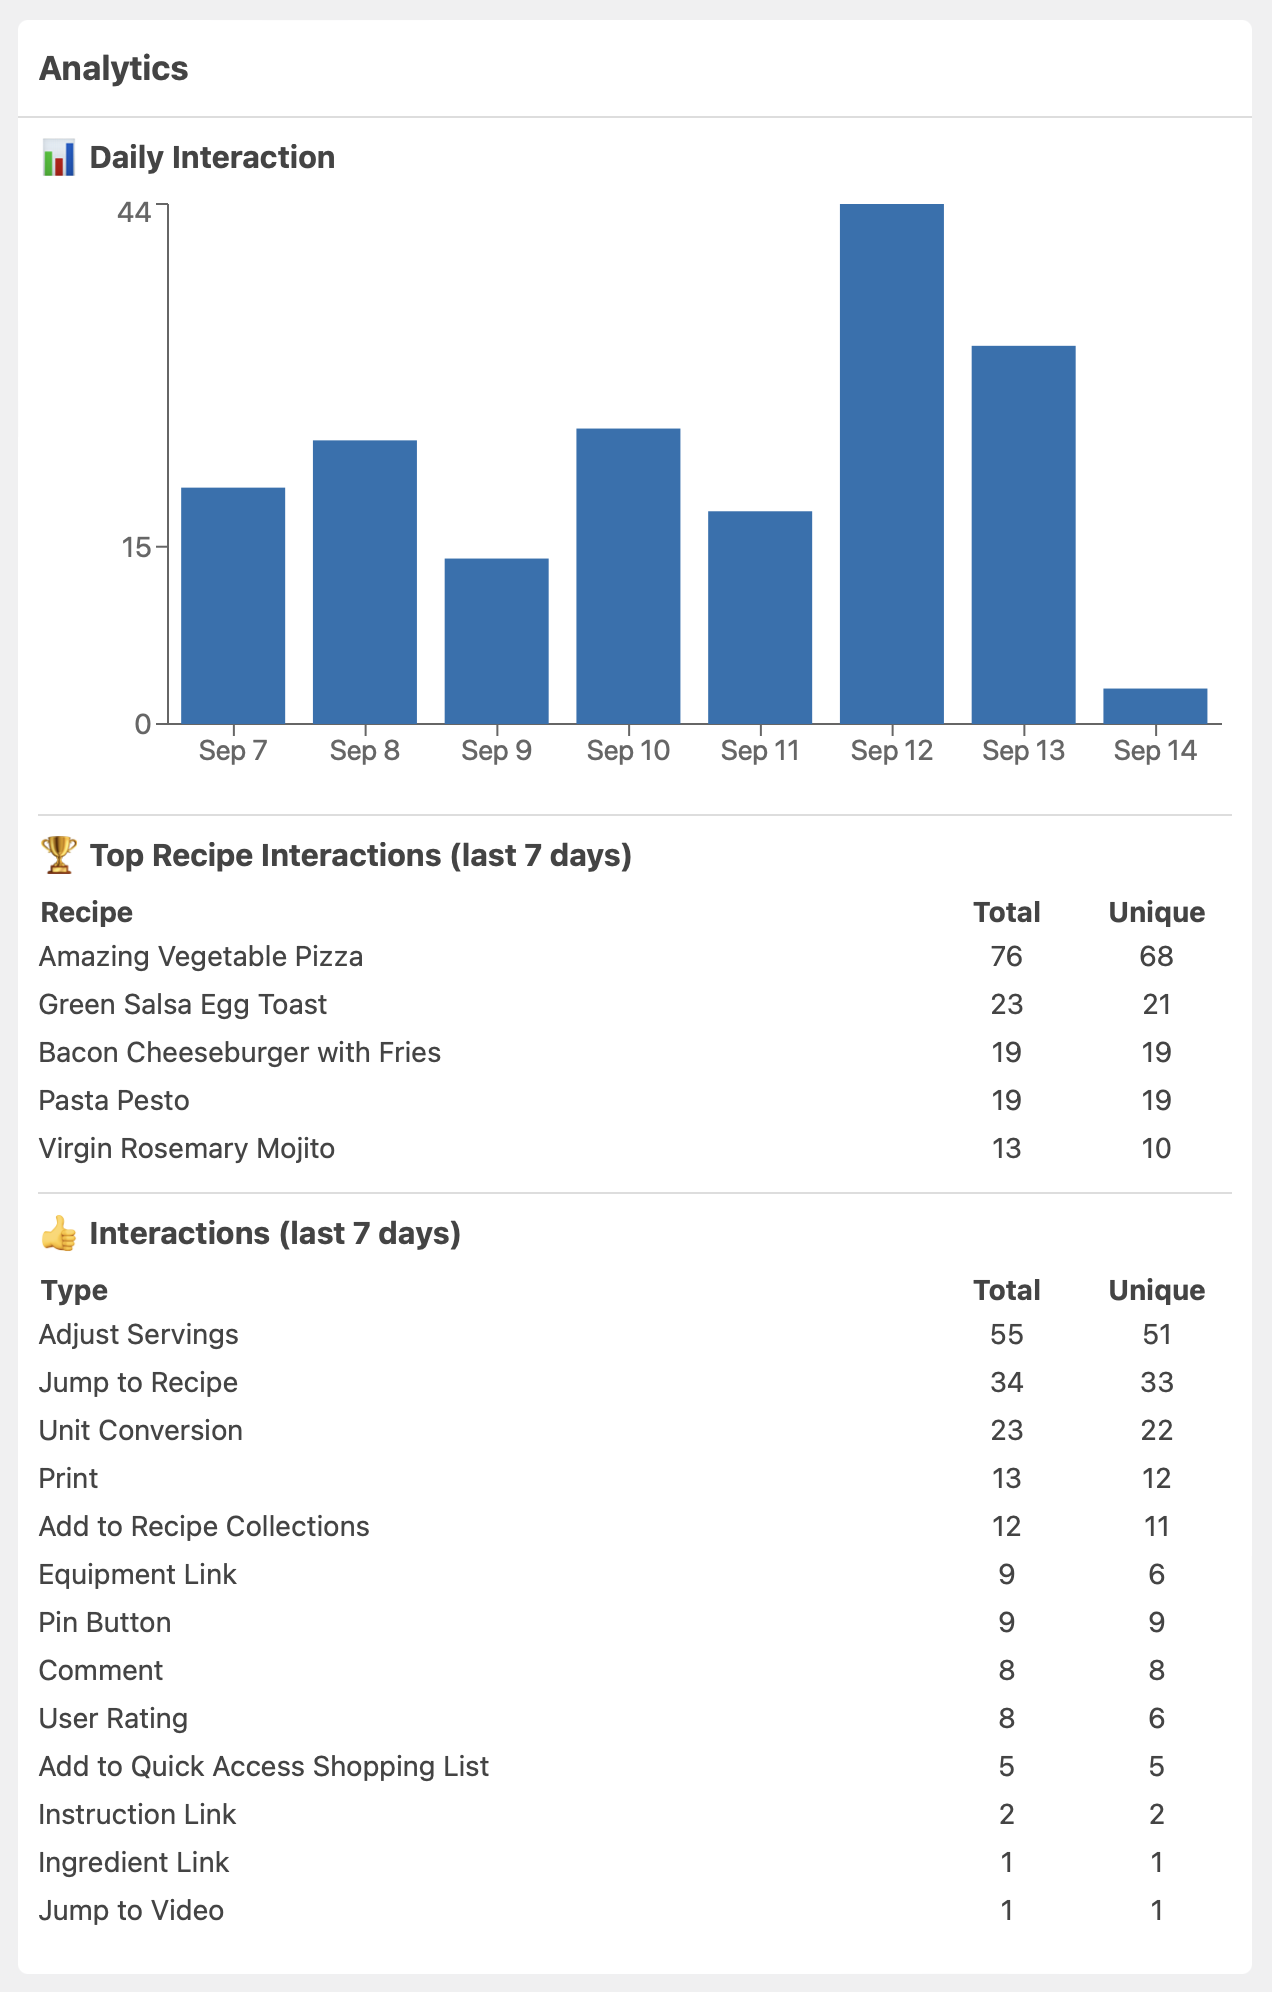
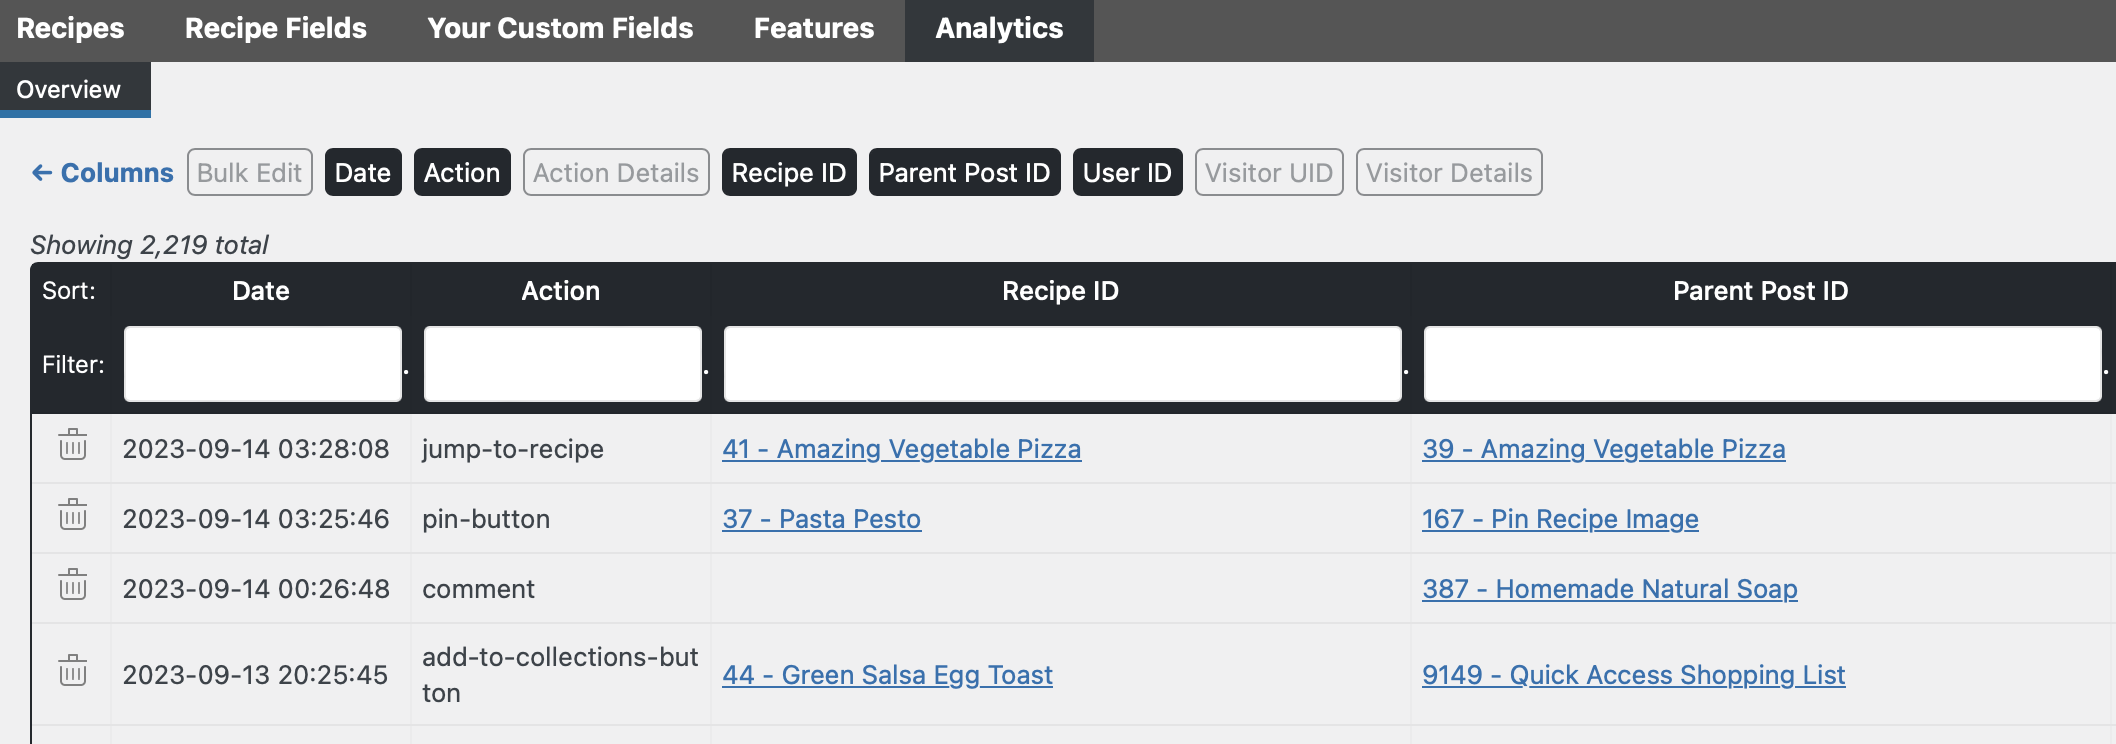
The raw data for this can be viewed on the WP Recipe Maker > Manage > Analytics page as well.
Recipe Interactions Report
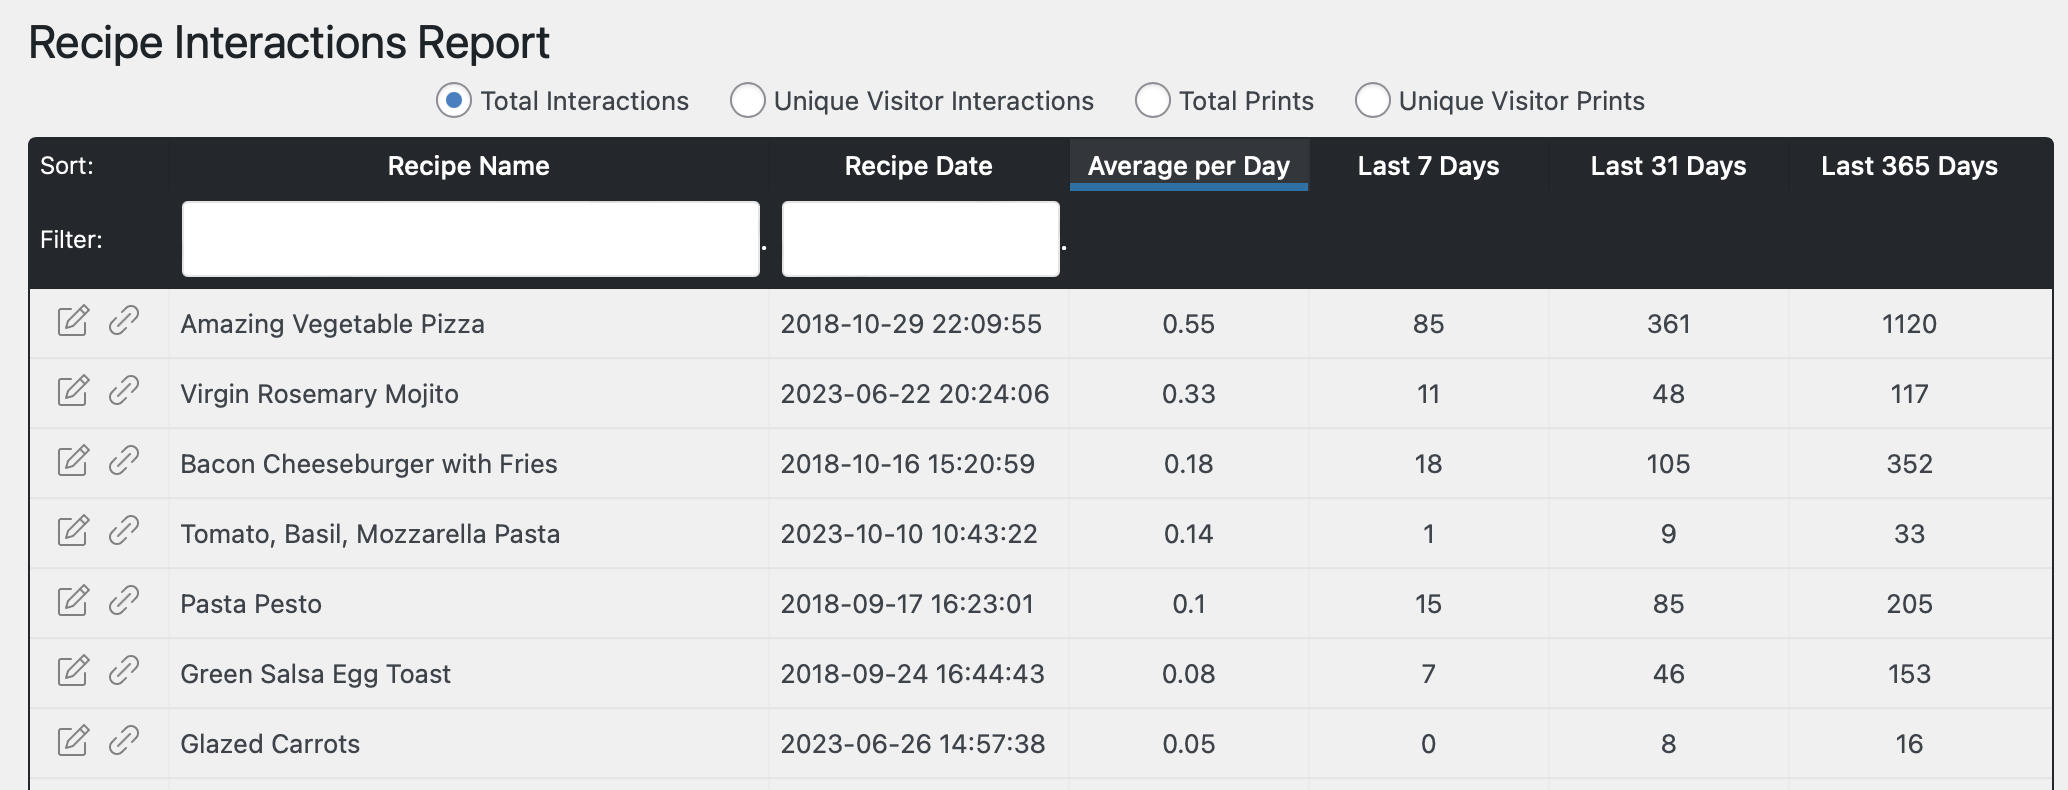
Section titled “Recipe Interactions Report”To learn more about interactions and find out which of your recipes are most interacted with, check out the WP Recipe Maker > Reports page. Once you generate the interactions report you’ll get an overview of the interactions per recipe:
Visualizing the rest of the data
Section titled “Visualizing the rest of the data”Originally this data was collected to send to a partner company, handling the recipe analytics software. Unfortunately they decided to stop offering that service, so at the moment it’s only the summary on the dashboard page and the raw data that gets collected.
We do plan on adding some more visualization options ourselves.
Alternatively, you could also enable the Google Analytics 4 Event Tracking to get the same interactions as events in Google Analytics.